In order to create Radar graphs the module
"jpgraph_radar.php" must first be included.
Radar plots are most often used to display how a number of results compare to some set targets. They make good use of the human ability to spot symmetry (or rather un-symmetry). Radar plots are not suitable if high accuracy readings from the graph are needed since, by it's nature, it can be difficult to read out very detailed values.
Figure 16.33. A typical radar graph with two radar plots added ( shows a basic radar graph with two radar plots
added.radarex7.php)
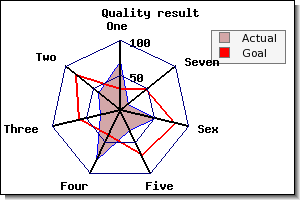
Radar graphs are created as an instance of class RadarGraph which
inherits all common formatting options from the standard class Graph
such as titles, background colors, background titles, etc.
Note
Tabbed titles cannot not be used for radar graphs since there is no applicable concept of a plot area
The following facts applies to a radar graph
-
There is one axis for each data point
-
Each axis may have an arbitrary title which is automatically positioned
-
A radar plot may be filled or open
-
The first axis is always oriented vertical and is the only axis with labels
-
Several radar plots can be combined in one radar graph
-
Axis can have either linear or logarithmic scale on the axis
In addition all the normal formatting of labels, background colors, grid lines, plot colors, fill colors etc. can be adjusted. The rest of this sections will show some of the typical formatting options available.
The principle is exactly the same as for line plots but instead of an x-y coordinate each data point represents a value on one of the axis. The number of axis will automatically be the same as the number of data points. Even through the library itself does not impose any restrictions on the number of axis there is a practical limit so it is probably best to keep the number of data points limited to around 10-12.
Typical data set for a radar plot is then given as
1 | $data = array( axis<1>_value, axis<2>_value, ..., axis<n>_value ); |
The plot points are assigned to the axis in a counter-clockwise direction starting at 12 a'clock. If clock-wise order is needed the input data must be reversed.
Creation of a radar graph follows the now familiar steps of first creating an
instance of class RadarGraph and then adding one or several
instances of class RadarPlot as the following code snippet
shows
1 2 3 4 5 6 7 8 9 10 11 12 13 14 15 16 17 18 19 20 21 22 23 24 25 26 27 28 29 30 31 32 33 34 | // Some data $data1 = array( ... ) ; $data2 = array( ... ) ; $width = ... ; $height = ... ; // Setup a basic radar graph $graph = new RadarGraph($width,$height); $graph->SetScale('lin'); // Add a title to the graph $graph->title->Set('Quality result'); // .. add any other common graph formatting // Create the first radar plot with formatting $plot1 = new RadarPlot($data1); $plot1->SetLegend('Goal'); $plot1->SetColor(̈́red', 'lightred'); // Create the second radar plot $plot2 = new RadarPlot($data2); $plot2->SetLegend('Actual'); $plot2->SetColor('blue', 'lightred'); // Add the plots to the graph $graph->Add($plot2); $graph->Add($plot1); // and display the graph $graph->stroke() ?> |
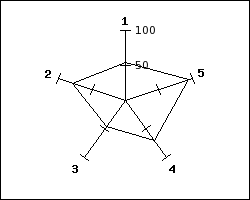
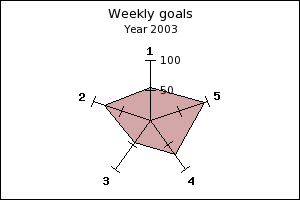
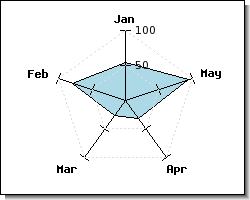
As an illustration two very basic radar graphs with one radar plot each are displayed below. The left figure uses only default values and the right figure uses the ame data but adjusts a few properties to make the graph a bit more interesting.
|
|
|
Each radar plot can also have a legend. As usual the text for the legend is created by using the method
-
RadarPlot::SetLegend($aText)
The legend box is accessed through the "$legend" property of the graph and this can be used to adjust the size, position and layout of the legend box (as described in Adjusting the position and layout of the legend).
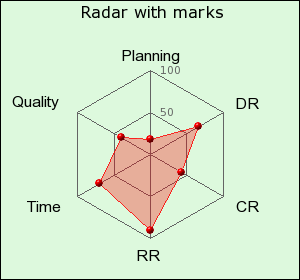
In exactly the same way as for line graphs it is possible to add plot marks in radar plots. The mark property is accessed through the instance variable
-
RadarPlot::mark
(All available plot marks are listed in Appendix E. Available plot marks)
For example to add a red ball marker the following line must be added
1 | $radarplot->mark->SetType(MARK_IMG_SBALL,'red'); |
In Figure 16.36. Adding plot marks to a radar graph ( we show a radar graph with added
plot-marks. In addition we have also chosen to hide the tick marks on the axis
and adjust some of the default colors.radarmarkex1.php)
(See Chapter 10. Using CSIM (Client side image maps) for a full description on the usage of CSIM together with the library)
If markers are shown for the polar plot (by setting the mark property of the
plot) each marker can be a hot spot in a client side image map. The target URL
are as usual specified with the SetCSIMTargets() as the following
short code snippet shows
1 2 3 4 5 6 7 8 9 | // Start by specifying the proper URL targets $targets = array( "#1" , "#2" , ....... ); $radarplot = new RadarPlot( $data ); $radarplot->mark->SetType( MARK_SQUARE ); $radarplot->SetCSIMTargets( $targets ); $graph->Add( $radarplot ); $graph->StrokeCSIM(); |
The scale of the axis can be either a linear or a logarithmic scale and is specified with the method
-
RadarGraph::SetScale($aScale, $aYMin=1,
                                $aYMax=1)
The scale is specified as a string and can be either "
lin" or "log"
The size and position of the radar graph are adjusted by the two methods
-
RadarGraph::SetSize($aSize)The size is specified as a fraction of min($weight,$height) and indicates the length of the axis.
-
RadarGraph::SetCenter($aXPos, $aYPos=0.5)The center of the graph can be specified as either a fraction of the width/height or as an absolute position.
The background color can be adjusted by
-
RadarGraph::SetColor($aColor)
All axis have the same formatting and the axis is access through the "$axis" property of the RadarGraph class. For example make the axis 2 pixels wide the following lines would be needed
1 2 | $radargraph = new RadarGraph($width,$height);
$radargraph->axis->SetWeight(2); |
The axis supports all the same formatting options as for standard x-y graphs. Some of the more commonly used methods for the axis formatting are
-
Axis::SetColor($aColor,$aLabelColor=false)Set the color of the axis and (optional) the labels
-
Axis::SetWeight($aWeight)Specifies width in pixels of the axis
-
Axis::SetLabelFormatString($aFormStr,$aIsDateFormat=false)Specify the format string to be used for the labels
-
Axis::SetLabelFormatCallback($aFuncName)Set the callback function to be used for the label formatting
-
Axis::SetFont($aFamily,$aStyle,$aSize)Sets the font property for the labels of the axis. Note that this will not effect the font property of the title of the axis.
In order to specify the titles for each axis the method
-
RadarGraph::SetTitles($aTitleArray)The argument is an array with as many entries as there are axis and where each entry specifies a text string which is the title of the axis.
Example 16.4. Having the name of the months as title of the axis
The easiest way to have the month name as titles is to use the library global variable "
$gDateLocale" as follows1 2
$titles = $gDateLocale->GetShortMonth(); $radargraph->SetTitles( $titles );
In order to adjust the property of the title for the axis the
"$title" property of the axis is used. For example, to set the
font and color for the titles of the axis the following two lines are
needed
1 2 3 4 | $radargraph->axis->title->SetFont(FF_ARIAL,FS_BOLD,12); $radargraph->axis->title->SetColor('darkred'); |
The tick marks can also be adjusted with the following methods
-
RadarGraph::HideTickMarks($aFlag=true)Hide all tick marks
-
RadarGraph::ShowMinorTickmarks($aFlag=true)Enable/Disable tick marks
-
RadarGraph::SetTickDensity($aDensity=TICKD_NORMAL)Adjust the tick density
Each major tick mark can also be connected together to create a grid in the
graph. The grid is accessed through the '$grid' property of the
graph. To enable the grid and set the line style to "dotted" the following two
lines must be added
1 2 | $radargraph->grid->Show ();
$radargraph->grid->SetLineStyle( 'dashed' ); |
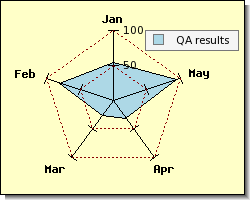
An example of dashed grid lines are shown in Figure 16.37. Enabling a dashed grid line ( . By default the grid lines have a gray color and are drawn behind the radar
plot and hence part of the grid lines are obscured.radarex4.php)
The property of the grid lines are adjusted by accessing the
"$grid" line. The available methods to format grid lines
are:
-
RadarGraph::grid::Show($aShowMajor=true)Enable grid lines
-
RadarGraph::grid::SetColor($aMajColor)Set the color of the grid lines
-
RadarGraph::grid::SetWeight($aWeight)Set the weight of the grid line
-
RadarGraph::grid::SetLineStyle($aType)Set the line style, can be one of "
dotted","dashed","long-dash","solid"
To make the grid lines in Figure 16.37. Enabling a dashed grid line ( more visible lets
change the color by using the radarex4.php)SetColor() method on the grid. In
addition we can also adjust the background color. The result of this is shown in
Figure 16.38. Enabling a dashed grid line with red ( radarex6.php)
|
|
|
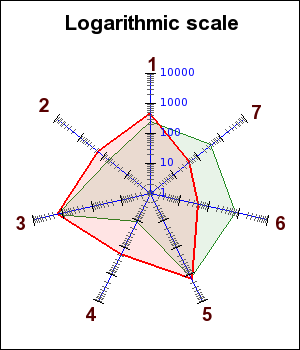
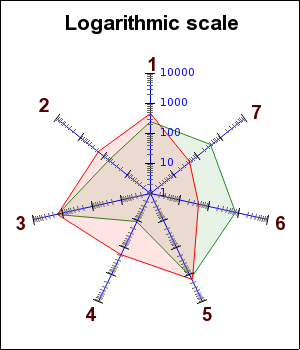
In order to change the (default) linear scale o the axis to use logarithmic scale the following line must be added:
1 | $graph->SetScale('log'); |
Figure 16.39. Using a logarithmic scale ( shows an example of a logarithmic radar
graph radarlogex1.php)
Radar graph are an excellent example where enabling anti-alias can make a large visual difference. In order to enable anti-aliasing the method
-
RadarGraph::img::SetAntiAliasing($aFlg=true)
must be called, for example as in
1 | $radargraph->img->SetAntiAliasing(); |
To give an example of this Figure 16.40. Enabling anti-alias for the logarithmic radar example ( shows an
anti-aliased version of Figure 16.39. Using a logarithmic scale radarlogex1-aa.php)( . (Another
comparative example of enabling anti-aliasing is also given in Figure 14.80. Plain radar plot radarlogex1.php)( and Figure 14.81. Anti-aliased radar plot radarex8.php)( .)radarex8.1.php)
Caution
Remember the limitation when using anti-aliasing that lines will be given line weight=1 regardless of the specified weight.
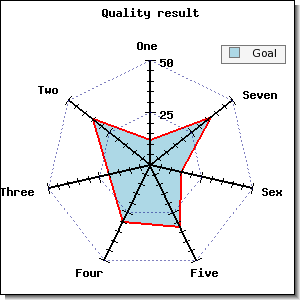
As a final example we shown a radar graphs were we have adjusted many of the
available properties, such as specifying a manual scale, to achieve the result
shown in Figure 16.41. A more complex example of a radar graph with a manual scale ( fixscale_radarex1.php)
Example 16.5. A more complex example of a radar graph with a manual scale (fixscale_radarex1.php)
1 2 3 4 5 6 7 8 9 10 11 12 13 14 15 16 17 18 19 20 21 22 23 24 25 26 27 28 29 30 31 32 33 34 35 36 | // content="text/plain; charset=utf-8" require_once ('jpgraph/jpgraph.php'); require_once ('jpgraph/jpgraph_radar.php'); $graph = new RadarGraph(300,300); $graph->SetScale('lin',0,50); $graph->yscale->ticks->Set(25,5); $graph->SetColor('white'); $graph->SetShadow(); $graph->SetCenter(0.5,0.55); $graph->axis->SetFont(FF_FONT1,FS_BOLD); $graph->axis->SetWeight(2); // Uncomment the following lines to also show grid lines. $graph->grid->SetLineStyle('dashed'); $graph->grid->SetColor('navy@0.5'); $graph->grid->Show(); $graph->ShowMinorTickMarks(); $graph->title->Set('Quality result'); $graph->title->SetFont(FF_FONT1,FS_BOLD); $graph->SetTitles(array('One','Two','Three','Four','Five','Sex','Seven','Eight','Nine','Ten')); $plot = new RadarPlot(array(12,35,20,30,33,15,37)); $plot->SetLegend('Goal'); $plot->SetColor('red','lightred'); $plot->SetFillColor('lightblue'); $plot->SetLineWeight(2); $graph->Add($plot); $graph->Stroke(); |