Table of Contents
- 22.1. Introduction
- 22.2. Creating and formatting a basic matrix graph
- 22.3. Mesh interpolating of input data
- 22.4. Formatting the matrix plot
- 22.5. Adding icon and text objects to the graph
- 22.6. Adding marker lines to the matrix plot
- 22.7. Using layout classes to position matrix plots
- 22.8. Built in color maps
- 22.9. Using CSIM with matrix plots
- 22.10. Matrix graph examples
Note
This module is only available in the pro-version of the library.
Matrix graphs are used to visualize the content of a rectangular matrix. Each entry in the matrix is mapped to a specific color which are then displayed in a rectangular plot corresponding to the size of the input matrix. The size of each module (corresponding to a matrix entry) is user customizable. There are two types of possible modules; circular and rectangular shape.
In order to achieve high quality rendering when circles are used the matrix module makes use of an optional (user settable) super-sampling to achieve an anti-alias effect to take the edge of the filled circles.
The color assignment to each value is controlled by the selected color map. The library first establish the min and max value in the matrix and then equates the min value with the "lower" end of the specified color map and the max value with the "higher" end of the color map. All values in between is linearly interpolated to a have a color between the "low" and "high" end in relation to the value (which are guaranteed to be between the min and max value previously established). There are several pre-defined color maps available as well as completely user configurable color maps.
The (optional) legend shows the range associated to each color in the corresponding plot.
Tip
The library supports mesh interpolation. Mesh interpolation which by itself doesn't produce any new data but can help produce smoother plots by creating "false" interpolated values in between the original entries in the matrix. This is similar to the Matlab (tm) command interp2
The overall structure and capabilities of matrix graphs follows that of other graphs
in the library, e.g. Windrose plots, in that a graph can have multiple plots, title,
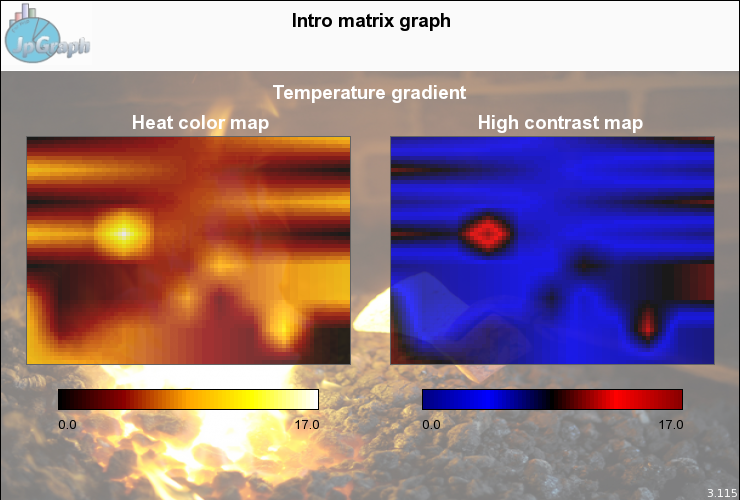
footers, texts, icons, image backgrounds etc. Figure 22.1. A medium complex example to shows some capabilities of matrix plots ( shows a medium complex example of two matrix
plots in a matrix graphs which uses both a background image, icon (the logo in the top
left corner), timing of the graph and free positioned text. We have also used a small
degree of alpha blending in the plots just to let the background "shine" through a
little bit. The two plots shows the same data but uses different color maps.matrix_introex.php)
Figure 22.1. A medium complex example to shows some capabilities of matrix plots ( matrix_introex.php)
The library offers an extensive range of formatting for the appearance of the plot when it comes to adjusting exactly how the colors are used. There are several built in color maps as well as the possibility to specify manual color maps and adjusting the contrast (scale range) of the plot.
-
Both manual and automatic scale range setting
-
Customizable legend position and layout
-
Row and column legends (edge labels)
-
Several built in color maps (22)
-
Option for manual specified color maps
-
Adjustable color contrast
-
Layout classes to position multiple plots in the sam graph
-
Both circular and rectangular module type
-
Mesh interpolation of input data
-
Flexible sizing of matrix plots both manual, automatic and a mix of them
-
Alpha blending support for matrix plot
-
All the usual graph support for background images, text objects and icons