Multiple Y axes
Introduction
This note will describe how to use the multi-Y-axis feature of the library. With this feature an arbitrary number of Y-axis can be added to the right end of the graph. The library itself doesn't impose any restrictions on the number of extra Y-axis but from a practical concern it is most likely very difficult to interpret a graph with more than 2-3 extra Y-axis.
If there is only need for one more Y axis then the concept of a additional Y2 axis has been available in the library for a very long time. The Y2 axis is also a first class citizen in the library meaning it has all the properties available to the "normal" Y-axis.
In this note we will focus more on a relatively new concept in the library and that is the multiple Y-axis feature.
These extra axis inherits most of the properties of the normal Y-axis (but not all) and the few restrictions imposed are described in the "Caveats" section below.
Figure 1. shows a basic example of how to use this feature. The color encoding maps a specific line to the corresponding axis.

Figure 1. Using multiple Y-axis for a single graph.
Adding more Y-axis to a Graph
Adding additional Y-axis is very similar to the way standard Y axis work. The Y-axis are numbered [0..n] where the 0:th axis is the Y-axis furthest to the left. At the same time as these additional Y-axis are used it is also possible to add a Y2 axis. The difference being that the Y2 axis can have all the same options as the Y axis.
For basic usage only three new methods are needed
-
Graph::SetYScale($aNbr,$aScaleType,$aMin,$aMax)
Specifies the type of scale ('lin', 'int' or 'log') to use for the axis number '$aNbr'
-
Graph::AddY($aNbr,$aPlot)
Add a plot to axis number '$aNbr'
-
Graph::SetYDeltaDist($aDistance)
This is an optional method that if used specifies the default number of pixels between each additional Y-axis. This value will be used unless a specific position for the N:th axis has been specified. By default the additional Y-axis are separated with 50 pixels (which is what is used in Figure 1)
The additional Y-axis are accessed through a the array
Graph::ynaxis[]
By accessing the axis through this array most of the same method as for the usual Y and Y2 axis are available. For example to specify the color of, say, axis number 1
$graph->ynaxis[1]->SetColor('red');
Using CSIM
Client Side Image Maps is fully supported and is used in the same way as CSIM for the basic Y-axis. A short example will clarify this.
The following code snippet shows a line plot where we have added some oversized markers (in the shape of diamonds) that will act as the image map areas.
...
$lp2 = new LinePlot($datay2);
$lp2->mark->SetType(MARK_DIAMOND);
$lp2->mark->SetWidth(15);
$lp2->SetCSIMTargets($targ2,$alts2);
$graph->AddY(0,$lp2);
...
As usual the targets for the image maps are specified with a call to Plot::SetCSIMTargets()
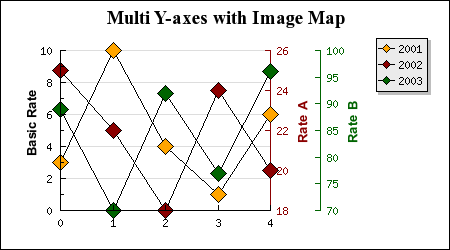
Figure 2. Using multiple Y-axis and Client Side Image Map.
Move the cursor over the markers
to see the value and target URL. (The script for this image is available in the Examples/ directory as
"mulyaxiscsimex1.php")
Caveat
- Only standard plots can be added to the extra Y-axis, this means no Text objects, no PlotBand, no PlotLines, no Icons etc
- Grid lines can not be added to the extra Y-axis
Example
We start by creating some random values for the four plots we will add to the graph
$n = 8;
for($i=0; $i < $n; ++$i ) {
    $datay[$i] = rand(1,10);
    $datay2[$i] = rand(10,55);
    $datay3[$i] = rand(200,600);
    $datay4[$i] = rand(500,800);
}
We then setup a basic graph. Worth noting here is the extra margin we add to the right side to make room for the extra axis.
$graph = new Graph(450,250);
$graph->SetMargin(40,150,40,30);
$graph->SetMarginColor('white');

$graph->SetScale('intlin');
$graph->title->Set('Using multiple Y-axis');
$graph->title->SetFont(FF_ARIAL,FS_NORMAL,14);
The next step is to setup the scale for the extra Y-axis. For this example we use plain linear scales.
$graph->SetYScale(0,'lin');
$graph->SetYScale(1,'lin');
$graph->SetYScale(2,'lin');
It is now time to create the plots, add them to the corresponding axis and also set the color for the plots and the axis.
$p1 = new LinePlot($datay);
$graph->Add($p1);

$p2 = new LinePlot($datay2);
$p2->SetColor('teal');
$graph->AddY(0,$p2);
$graph->ynaxis[0]->SetColor('teal');

$p3 = new LinePlot($datay3);
$p3->SetColor('red');
$graph->AddY(1,$p3);
$graph->ynaxis[1]->SetColor('red');

$p4 = new LinePlot($datay4);
$p4->SetColor('blue');
$graph->AddY(2,$p4);
$graph->ynaxis[2]->SetColor('blue');
In this example we are not using a Y2 axis so the Yn axis number 0 will be positioned at the right side of the plot area.
The final step is of course to send back the image to the browser.
$graph->Stroke();
This example is also available in the Examples directory as 'mulyaxisex1.php'