Tables - Part I
This is only available in the Pro-version of the library.
When visualizing data it is often useful to have both a quick graphical view which can show high level trends and a detailed view with the exact figures. The pro-version of JpGraph now supports the creation of graphic tables in all available graph types. Figure 1. shows an example on how this can be used together with a bar graph to show detailed figures.
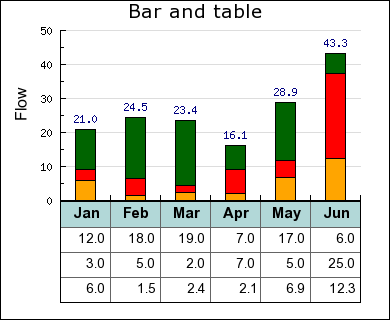
Figure 1. Illustrating data with both a graph and a table.
The specification of the tables data, position, fonts, alignment, colors, borders etc. is all fully flexible with an intuitive set of APIs to control the table. In this HowTo we will start by showing how to build basic tables which we will augment with more advanced formatting by introducing the formatting capabilities one by one.
In addition to adding data tables to graphs it is also possible to create graphic tables on the fly all by its own. This has the advantage compared with HTML tables to allow users to make copies of the table while maintaining the exact formatting of the table. Figure 2. shows an example with just a graphical table
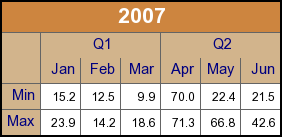
Figure 2. Creating a table without any graph.
In this first part we will introduce the basic concepts of tables and explain the basic formatting possibilities that are available. In the second part we will show in detail some typical use cases that illustrates some more advanced use of tables, for example how to construct the graph in Figure 1.
Basic tables
A table is created as an instance of the class GTextTable and can be managed in much the same way as for example Icons, Texts or other plot objects. It can be added to the graph (at specified X and Y coordinates) using the standard Graph::Add() method.
The creation of a table starts with including the necessary file "jpgraph_table.php" which contains the class definition for th GTextTable class. Creating a a new table is then just matter of creating a new instance of the class and calling the initialization method with the desired size (in rows and columns) of the table.
require_once "jpgraph.php";
require_once "jpgraph_table.php";

$table = new GTextTable();
$table->Init(5,7); // Create a 5 rows x 7 columns table
...
The next step is to populate the table with some data using the Set() method. This method is polymorphic and can be called in two different ways.
It can either be used to specify the value of each individual cell by identifying the cell by its row and column index (starting at 0) ways. For example to continue the example above we set the first two cells on the first row to 1 and 2 vi the two calls
...
$table->Set(0,0,1);
$table->Set(0,1,1);
...
The second, and probably less tedious way is to setup a 2-dimensional array (matrix) with suitable values and then pass that 2-dimensional array as the first and only argument to the Set() method.
The following basic full example creates a 2 rows by 4 columns table with consecutive values. Note here that we make use of CanvasGraph to provide the graph on which to add the table. The result of this script is shown in Figure 3.
<?php
// Script for Figure 3.
include '../jpgraph.php';
include '../jpgraph_canvas.php';
include '../jpgraph_table.php';

$graph = new CanvasGraph(70,50);

// Setup the basic table and data
$data = array( array(1,2,3,4),array(5,6,7,8));
$table = new GTextTable();
$table->Set($data);

$graph->Add($table);
$graph->Stroke();
?>

Figure 3. The most basic 2x4 table created by the short script above.
In the example above we also made use of a minor shortcut. If the data to the table is specified with a 2-dimensional array there is no need to call the Init() method since the size will be determined by the supplied array.
We will not yet begin discussion how to change fonts, colors and grids. Instead we will focus on the structure of the table and introduce the merge operation.
Merging cells
The only way to change the structure (as opposed to the look & feel) of the table is by merging two or more cells. The merge operation is done via one of three method calls:
- MergeRow()
- MergeCol()
- MergeCells()
The first two methods are really just simplifications for the third most generic method. The first two methods merge all the cells in a specified row or column and the third method merges any arbitrary range of cells.
In addition, by default, these calls will also center align the text in the merged cells (both horizontally and vertically). This can however be adjusted by giving the wanted alignment as additional argument to the methods or by calling the specific APIs that controls the alignment of the data within each cell.
The third (and most generic) method merge a range of cells specified by the top left and bottom right corner. So, for example, to merge the rightmost four cells in the previous example the method call would be
$table->MergeCells(0,2,1,3);

Figure 4. Merging the rightmost 4 cells in the table in Figure 3.
The merged cell is referenced by the top left of the original merged cell range. This means that the merged cell in the above example is referred to as the (0,2) cell.
If we instead wanted to merge the top row of the table we could have simplified the call by using one of the alternative merge methods. In this case the MergeRow() method would be applicable as in
$table->MergeRow(0);
which would then give the table as shown in Figure 5.

Figure 5. Merging the top row of Figure 3.
In summary, the following three rules apply to merging and/or merged cells
- It is an error to try o merge already merged cells.
- A merged cell is referenced by the top left cell in the merged range.
- All formatting that can be applied to a single cell can also be applied to a merged cell.
Fonts
The most basic way to change the look and feel of the table is to adjust the font that is used in the different cells in the table. To adjust the font within the table the following methods are available
- SetFont(), Specify the default font for the entire table or for a specified range of cells
- SetRowFont(), Specify the font for an entire row of cells
- SetColFont(), Specify the font for an entire column of cells
- SetCellFont(), Specify the font for a single cell
By default the font in the table is set to FF_FONT1, i.e. the built-in bit mapped font of medium size. The default color of the font is 'black'.
Note: If several font settings are applied to the same cell it will be the last method call before the table Stroke() method that will take precedence.
As a simple exercise we show how to adjust the font used in the first merged row in the previous example.

Figure 6. Adjusting the font in the top row of Figure 3.
The font in Figure 6. was adjusted with a call to
$table->SetCellFont(0,0,FF_ARIAL,FS_BOLD,14);
Polymorphic SetFont()
Before finishing this section it is worth noting that the SetFont() method is
polymorphic and can be called in two different ways.
In the first way it can be called with a single font (triple) argument. That font specification will then become the default for all cells in the table, for example
$table->SetFont(FF_TIMES,FS_NORMAL,12);
will set the entire table to use Times TTF font.
In the second way the first four arguments specifies a cell range (top left, bottom right) to apply the font setting to, for example
$table->SetFont(0,1,1,2,FF_TIMES,FS_NORMAL,12);
Colors
In order to adjust the look and feel of the table it is possible to set the following colors of the table:
- The color of the text/number in each cell
- The background color of each cell
- The color of the grid (inside the table) and border (around the table)
The font color for a cell (or range of cells) is specified with one of
- SetColor(), Set the color for a range of cells or the entire table
- SetRowColor(), Set the color for a specified row of cells
- SetColColor(), Set the color for a specified column of cells
- SetCellColor(), Set the color for a specified cells
In a similar way the background color (or the fill color) of a cell can be specified with
- SetFillColor(), Set the fill color for a range of cells or the entire table
- SetRowFillColor(), Set the fill color for a specified row of cells
- SetColFillColor(), Set the fill color for a specified column of cells
- SetCellFillColor(), Set the fill color for a specified cells
The way to adjust the color of the grid and border will be discussed in the section regarding borders and grids below.
Polymorphic SetColor() and SetFillColor()
In the same manner as SetFont() can act on both all cells and a specified range of cells the two color setting methods work in the same way. Both SetColor() and SetFillColor() can both be called either with a single argument (in which all cells will be addressed) or by giving a range (top left and bottom right cell) to be acted upon. For example the following hypothetical method calls will set the background color of the first three cells in row 2 and 3 and the entire table
...
// First set the default fill color to lightgray
$table->SetFillColor('lightgray');

// The Set a range to yellow
$table->SetFillColor(2,0,3,2,'yellow');
...
Finally we now give some concluding examples to make the usage of these methods more clear.
...
// Set the default font color for all table cells
$table->SetColor('darkgray');

// Set the font color for all cells in row one
$table->SetRowColor(1,'darkgray');

// Set the font color for the first two cells in the second row
// (row with index=1)
$table->SetColor(1,0,1,1,'darkgray');
...
Note: If there are multiple color settings for the same cell then the last method called before the final Stroke() call will be the color that shows.
For example
the following script sets the color of cell (0,0) to both 'black' and 'yellow'
but since the yellow is the last method to be called this is the color that will be used for cell (0,0)
...
$table->SetRowColor(0,'black');
$table->SetColColor(0,'yellow');
...
$graph->Stroke();
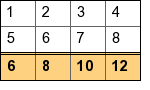
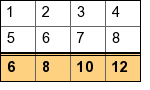
Finally, we illustrate the usage of these method by continuing with the previous example and coloring row 0 as shown in Figure 7.

Figure 7. Merging and setting the colors the top row of Figure 3.
The coloring in Figure 7. was accomplished by adding the following two lines to the previous script.
$table->SetCellFillColor(0,0,'orange@0.7');
$table->SetCellColor(0,0,'darkred');
The same effect could also have been accomplished by using the row version of the color methods as in
$table->SetRowFillColor(0,'orange@0.7');
$table->SetRowColor(0,'darkred');
Which sets of methods to use in this case is a matter of personal preference since both achieve the same effect.
Adjusting table and cell size
The exact size of the table can only be indirectly controlled by specifying the width of the columns and the height of the rows. The width/height can either be controlled individually on a row by row (or column by column) basis or by giving all rows/columns the same width/height. This is accomplished by the methods
- SetMinRowHeight(), Sets the minimum height of rows
- SetMinColWidth(), Sets the minimum width of columns
As can be noted from the name of the methods the width and height specified is not necessarily the exact size of the row/column. It's just the minimum size. The actual size is depending on the text in the cells. The row height (and column width) will always grow in order to fit the text within the largest cell.
Polymorphic functions
The number of arguments to the two methods can in fact be either one or two. If only one argument is supplied then it is interpretated as the minimum width/height for all columns/rows in the table. If two arguments are used then the first argument will specify what row/columns the height/width is specified for.
Continuing with the table in Figure 7. If we want to make sure that all the cells in row 1 is at least 35 pixels wide we could add to add the following in the previous script
...
$table->SetMinColWidth(35);
...
Which would then give the table shown in Figure 8.
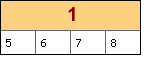
Figure 8. Setting the minimum column width to 35 pixels.
Fine tuning cell alignment and cell padding
The final bit of important formatting is the ability to specify the alignment of the data in each of the cells within the table. It is possible to specify both the horizontal and vertical alignment. The alignment can be specified as one of
- Horizontal alignment: "left", "right", "center"
- Vertical alignment: "top", "bottom", "center"
As usual there are four variants of the alignment methods
- SetAlign(), Set the align for a range of cells or the entire table
- SetRowAlign(), Set the alignment for an entire row
- SetColAlign(), Set the alignment for an entire column
- SetCellAlign(), Set the alignment for a specific cell
Each of the methods accepts two alignment arguments, the horizontal and the vertical alignment. We don't give any examples here since the usage of these methods should be obvious.
Note: It should be mentioned that in addition to using these methods the alignment can also be set when using the merge methods (as discussed above). This is purely as a a convenience since it is such a common use case to adjust the alignment when merging cells.
Adjusting border and grid lines
The final formatting option available is the shape, size and color of the border and grid lines in the table. As of this writing the library supports the following styles of grid lines.
- TGRID_SINGLE, a basic solid line of specified width and color (default)
- TGRID_DOUBLE, two lines of equal width separated by the same width as the line width.
- TGRID_DOUBLE2, two lines where the left/top line is twice as thick as the bottom/right line.
|
|
Figure 9 a, b. The two different variants of double grid line
The methods available to adjust the grid lines are
- SetGrid(), Set the grid line style for all grid lines
- SetColGrid(), Set the specified vertical grid line
- SetRowGrid(), Set the specified horizontal grid line
The borders in Figure 9 was modified by adding the following call to the basic table script.
$table->SetRowGrid(2,1,'black',TGRID_DOUBLE);
and
$table->SetRowGrid(2,1,'black',TGRID_DOUBLE2);
The order of the arguments are 1) Row, 2) Width (weight) and 3) Line style.
Finally, in order to adjust the outer border of the table there is one last method available
- SetBorder(), Set the width and color of the outer border
Tip: In order to remove a specific grid line or the border the width is specified as 0
As a final example let's do just that, remove a lot of grid lines and borders by adding the following lines to the previous basic table script.
...
$table->SetBorder(0);
$table->SetGrid(0);
$table->SetRowGrid(2,1,'black',TGRID_DOUBLE2);
...
The result of this modification is shown in Figure 10 below.
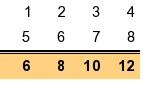
Figure 10. Removing some grid lines and border. In addition we have right aligned all the cells as is common practice for numeric data.
Specific number formatting
The final method of formatting we will briefly touch upon is the number formatting. By setting a specific number formatting it is possible to have numeric values formatted in a uniform way regardless of the original format. The number format is the same format string that would be used with the printf() family.
The available methods for this formatting follows the usual structure
- SetNumberFormat(), Set the number format for a range or the whole table
- SetRowNumberFormat(), Set the number format for a specific row
- SetColNumberFormat(), Set the number format for a specific column
- SetCellNumberFormat(), Set the number format for a specific cell
To illustrate the use of this formatting we take start with the table in Figure 10. and apply the format string "%0.1f" which will format the values as floating point values with one decimal. We do this by adding the method call
$table->SetNumberFormat('%0.1f');
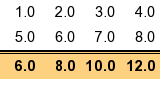
Figure 11. Applying a number format to the data in the cells from Figure 10.
to the previous script.
Note: The number format will only set the number format it will not do any rounding of the actual values. This is the responsibility of the client.
Using images and country flags in the table
In addition to ordinary text it is also possible to have arbitrary images (read from a file) or use one of the built-in country flags available in the library as background images in the table cells. The methods available for this purpose are
- SetImage(), Set the same image for all cells or a range of cells>
- SetCellImage(), Set the image for a specific cell
- SetRowImage(), Set the image for a row of cells
- SetColImage(), Set the image for a column of cells
- SetCellImageConstrain(), Set the height or width of an image in a specified cell
- SetCellCountryFlag(), Use a specified country flag as image in a specified cell
For example, to add the United Kingdoms flag in cell (2,1) in the table one would have to add the the call
$table->SetCellCountryFlag(2,1,'united kingdom');
as usual with the background images it is possible to scale it and also adjust the mix-in factor by using additional arguments to the above methods.
However there is on extra feature available with images and tables. If we wanted to make sure that the flag is of a specific height or width it is possible to specify this and have the library autoscale the image to fith the specified parameter.
For example to restrict the height of the UK flag set in cell (2,1) to 20 pixels the call would be
$table->SetCellImageConstrain(2,1,TIMG_HEIGHT,20);
We conclude this section with a small example on the use of country flags in a table.
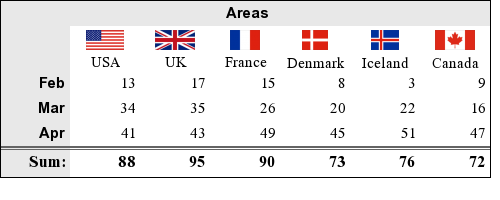
Figure 12. Using country flags in the table cells
Overview of Table APIs
In this overview we do not give details about the arguments required by each method. Instead this is meant as an overview to get a feel for what is available in the library. All details are provided in the class reference.
| Constructing | |
| GTextTable() | Create a new table |
| Init() | Specify table size |
| Set() | Specify data in table |
| SetPos() | Specify position of table in graph |
| SetScalePos() | Specify scale position of table in graph |
| SetAnchorPos() | Specify anchor position for table. By default the top left corner of the table will be aligned with the specified position. |
| Merging cells | |
| MergeCol() | Merge all cells in the same column |
| MergeRow() | Merge all cells in the same row |
| MergeCells() | Merge all cells in a range |
| Font specification | |
| SetFont() | Set default font for range or entire table |
| SetRowFont() | Set font for a specific row |
| SetColFont() | Set font for a specific column |
| SetCellFont() | Set font for a specific cell |
| Font color | |
| SetColor() | Set default font color for range or entire table |
| SetRowColor() | Set font color for a specific row |
| SetColColor() | Set font color for a specific column |
| SetCellColor() | Set font color for a specific cell |
| Fill color | |
| SetFillColor() | Set fill color for range or entire table |
| SetRowFillColor() | Set fill color for an entire row |
| SetColFillColor() | Set fill color for an entire column |
| SetCellFillColor() | Set fill color fro a specific cell |
| Alignment in cells | |
| SetAlign() | Set default align for range or entire table |
| SetRowAlign() | Set align in a specific row |
| SetColAlign() | Set align in a specific column |
| SetCellAlign() | Set align in a specific cell |
| Borders and grid | |
| SetBorder() | Set weight of border around the table |
| SetGrid() | Set style and weight for interior grid |
| SetColGrid() | Specify grid for a specific column |
| SetRowGrid() | Specify grid for a specific row |
| Background images & country flags | |
| SetImage() | Use the specified image as background |
| SetCellImage() | Use the specified image as background |
| SetRowImage() | Use the specified image as background |
| SetColImage() | Use the specified image as background |
| SetCountryFlag() | Use a country flag as background |
| SetImageConstrain() | Specify width or height for cell image (or flag) |
| Width and height of cells | |
| SetMinColWidth() | Set minumum column width |
| SetMinRowHeight() | Set minimum row height |
| Number formatting | |
| SetNumberFormat() | Set number format for range or entire table |
| SetRowNumberFormat() | Number format fro a specific row |
| SetColNumberFormat() | Number format fro a specific column |
| SetCellNumberFormat() | Number format fro a specific cell |
| Cell padding and margins | |
| SetPadding() | Set default padding for range or all cells |
| SetRowPadding() | Set padding in a specific row |
| SetColPadding() | Set padding in a specific column |
| SetCellPadding() | Set padding in a specific cell |
| CSIM Handling | |
| SetCellCSIMTarget() | Set URL target for specified cell |
| SetCSIMTarget() | Set URL target for all cells. By using this method it is also possible to have an automatic row and column index appended to the target URL as GET parameters |
Some finishing examples
We finish this part with a few more examples of how the same data but with slightly different formatting can give both different impressions and affect the readability.
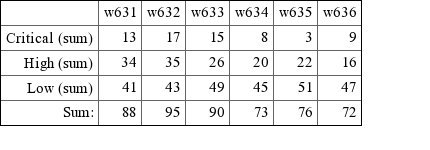
Figure 13a. Table formatting, variant 1, right adjusted Times font
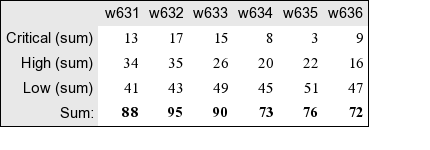
Figure 13b. Table formatting, variant 1, using Times font for data and a sans serit font for headings together with removed grid lines and filled headers.
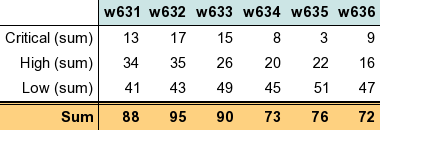
Figure 13c. Table formatting, variant 2, using the same sans serit font for all information but with some grid lines.
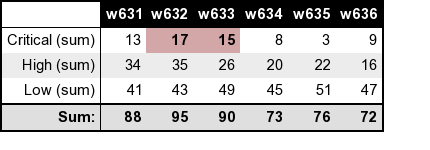
Figure 13d. Table formatting, variant 3, where some data is highlighted and we use a thicker border.
The next step - Part II
In the second part of this HowTo we will walk through some more advanced formatting exercises to show some common use cases for mixing graphs and tables as is illustrated in Figure 1.